Applying R Scripts in Rulex Processes
The R Bridge task allows you to perform statistical calculations via R script on Rulex data, and either overwrite the original dataset with the output results, or create a new dataset (such as clusters or advanced association structures).
This type of task may be useful when you already have statistical algorithms in R, and want to use them in Rulex without having to rewrite any of the logic.
The R script can either be entered directly in the task, or a reference can be provided to an external script file.
Prerequisites
R software is installed where Rulex is running.
Additional tabs
The following additional tabs are provided:
Documentation tab where you can document your task,
Parametric options tab where you can configure process variables instead of fixed values. Parametric equivalents are expressed in italics in this page (PO).
Procedure
Drag and drop the R Bridge task onto the stage.
Connect the task that contains the dataset on which you want to perform the R script to the R Bridge task.
Double click the R Bridge task.
Configure the script options as described in the table below.
Save and compute the task.
R bridge options | ||
|---|---|---|
Name | PO | Description |
General options | ||
Get input from | setref | Select the type of data you want to use as input for the R script. Possible options are:
|
Name of the Rulex input table in R script | rinputname | Enter the name you want to use within the R script to reference the data received from Rulex. For example, if you selected Dataset in the Get input from option, and you enter Input as the name here in this option, the main Rulex data table will be referred to as a data frame called "Input" within the R script. |
Get R script from file | scriptfromfile | Select this option if you want to reference an external script file. Alternatively you can enter the script code directly in the R Code edit box below. This edit box will be disabled if you decide to reference an external file to avoid confusion on which script will be applied. |
Select R script | filename | Click here and browse to the external file, which contains the R script you want to apply. This option will be enabled only if you have selected the Get R script from file option. |
Store output in | outref | Select the type of table that will be populated by the data.frame selected as output in the R script. Possible options are:
|
Name of the output data frame in R script | routputname | Enter the name you want to use in the R script to reference the data Rulex will receive from R. This data will populate the table according to the option selected in Store output in. |
Select file to store R console output | debugfilename | Browse to the text file where the R script console output will be saved after execution of the R Bridge task. |
R Code | rcode | Enter the R script code you want to execute. This text box is enabled only if you have not selected the Get R script from file option. |
Connection options | ||
Select path to Rterm command | rcommand | Browse to the location of the Rterm command. The default path on a Windows system, corresponding to the default value of this option, is “C:/Program Files/R/R-3.3.2/bin/x64/Rterm.exe”. If the path is not correctly specified, the R Bridge task will not work correctly and a warning message will be displayed. The RBridge task cannot compute if another Rterm process is pending. You can monitor this on Windows via the Task Manager (Processes). |
R host | rhostname | Enter the address of the host where R is installed. If Rulex is running on the same desktop where it is installed you can enter localhost. |
R port | rport | Specify the port used for data transfer between Rulex and R (i.e. input table transfer from Rulex to R, output data frame transfer from R to Rulex). System firewall exception Make sure you define an exception in the system firewall on this port, allowing the data exchange between the two applications. Otherwise, the task will not be executed and a warning message will be displayed signaling a communication problem between Rulex and R. |
R port for signals | rportaux | Specify the port used for signal transfer between Rulex and R (i.e. progress bar updates). System firewall exception Make sure you define an exception in the system firewall on this port, allowing the data exchange between the two applications. Otherwise, the task will not be executed and a warning message will be displayed signaling a communication problem between Rulex and R. |
setprogress command
The setprogress command, which updates a progress bar, increasing it by a corresponding progress percentage, can be set via the R code text box, or via a referenced external script.
For instance, if the current progress value is 10 and a setprogress(10) command is executed, the progress bar is increased by (100-10)*10% = 9%, that is to 19%.
If R libraries are referenced in the script (through the “library” R instruction), you should install them previously, in their native R environment, instead of inserting the install.packages instruction directly in the R Code window. However, the install.packages command can be run from Rulex only if Rulex itself is executed with administrative privileges: otherwise, a warning concerning this issue will be raised and the execution will not terminate.
Example
The following examples are based on the Walmart Recruiting - Store Sales Forecasting dataset.
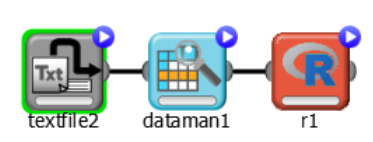
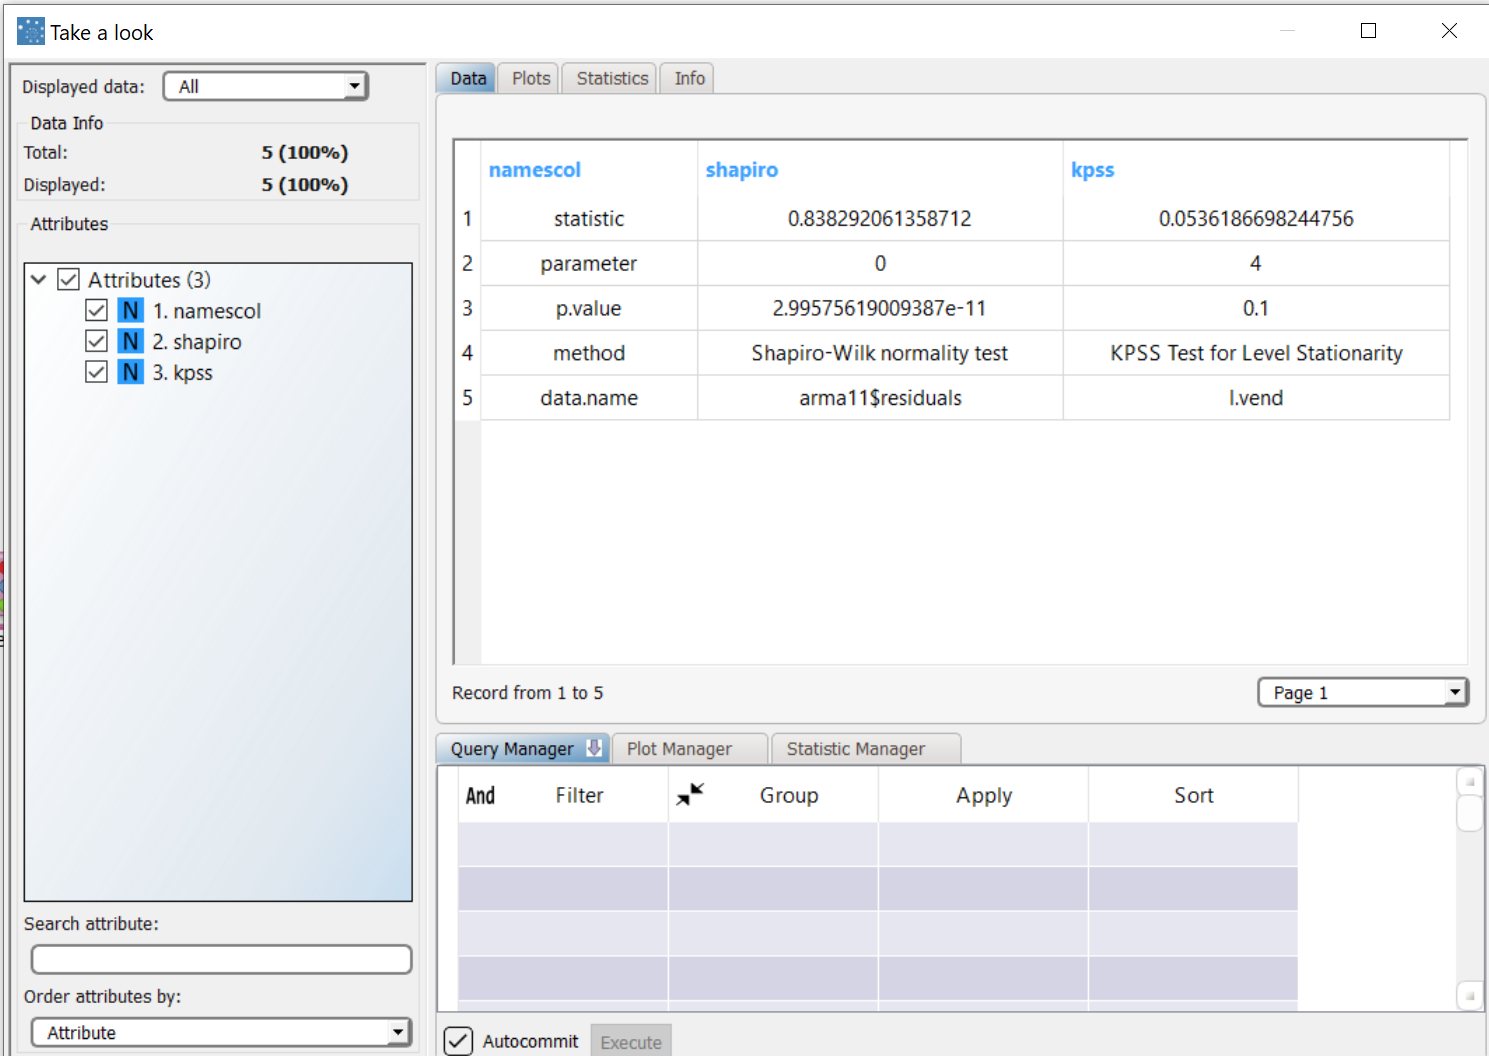
The scenario groups and sums the weekly sales of all departments and stores in Rulex, using R to generate an arima model for the corresponding time series and execute the Shapiro-Wilk and kpss statistical tests on it and then return the results of these tests to Rulex.
Walmart datasets can be downloaded directly from the Kaggle website: https://www.kaggle.com/c/walmart-recruiting-store-sales-forecasting/data
In order to perform this scenario, you must install the IMTest and tseries libraries.
The following steps were performed:
We then group and sum the data in a Data Manager task.
We then add a R Bridge task and enter the R script code directly in the task options.
We finally use the Take a look function to check the results of the R script.
Procedure | Screenshot |
|---|---|
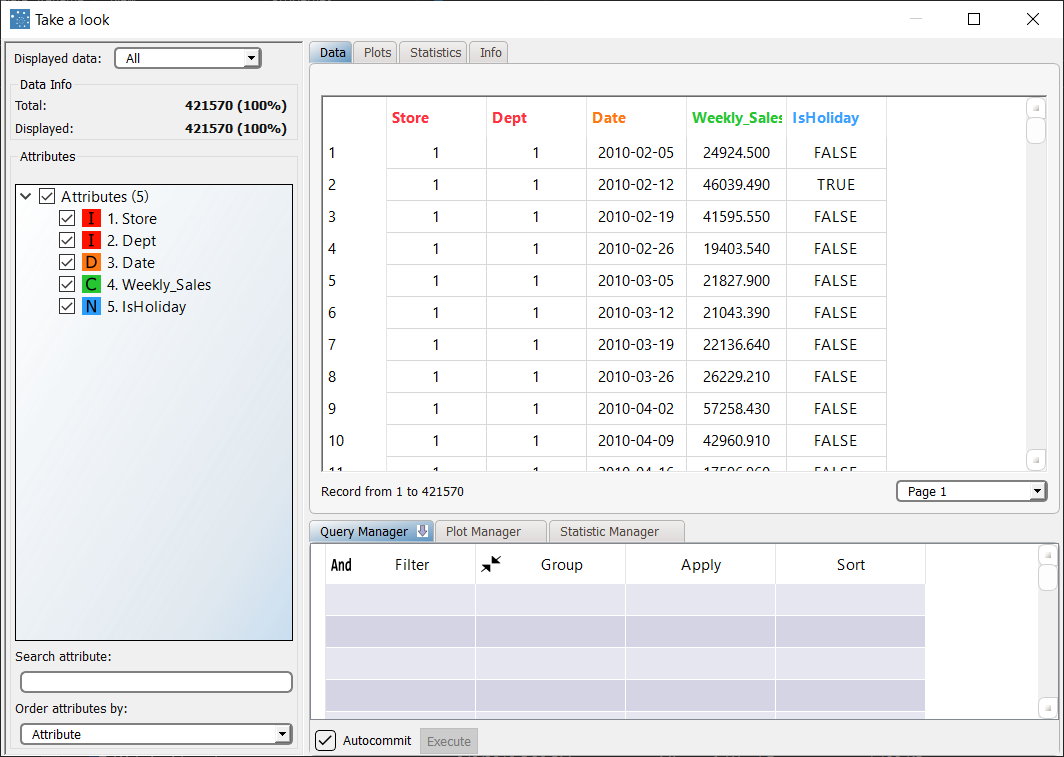
Importing the train.csv dataset via an Import from Text File task, and select comma as the data separator. Then right-click the task and select Take a look to display the imported data. The original dataset contains 421570 patterns. | |
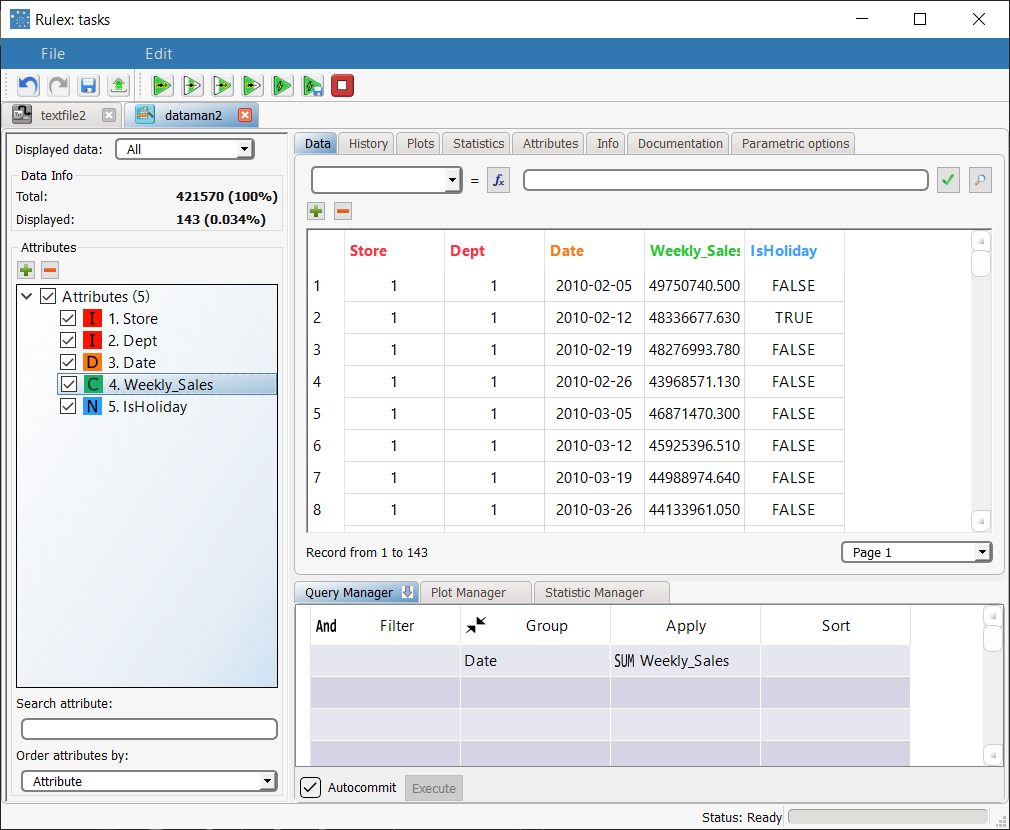
In the Data Manager task, group the dataset by the Date attribute, and apply the SUM function to the Weekly_Sales attribute. Then save and compute the task. 143 patterns are now displayed in the task. | |
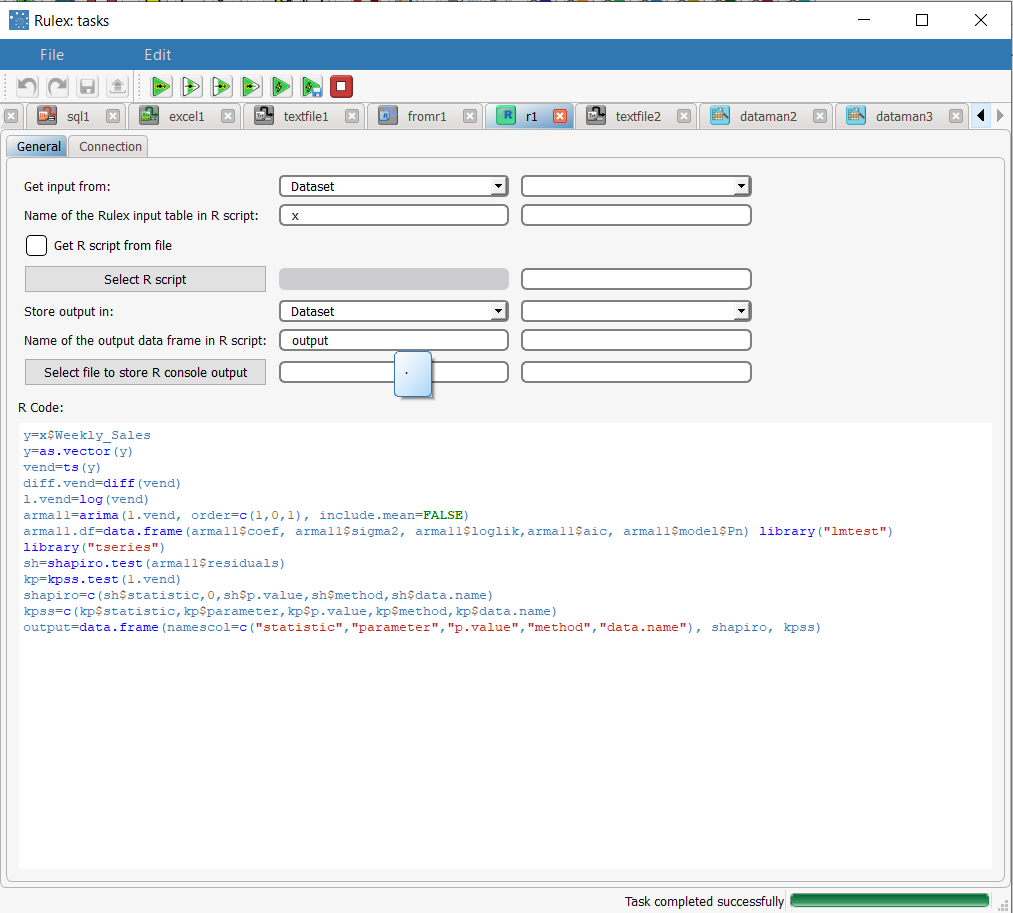
Connect an R Bridge task to the process, and configure it as follows:
| |
Enter the script to the right in the R Code text box. The script computes our reference time series, as the log-transform of the Weekly_Sales column deltas over time. Then we build an ARMA model on this time series and, via the lmtest and the tseries R libraries (see library(“IMTest”), library(“tseries”) in the R script code) we execute:
| y=x$Weekly_Sales As specified by the values set for the options Store output in and Name of the output data frame in R script, the R bridge task will overwrite our dataset with the content of the data.frame named output in our script (if no data.frame named output were found, a warning message would be raised). Then, as we can see in the final lines of the script, we create a data.frame named output and we populate it with the result of the two tests. |
Save and compute the task, then right-click it and select Take a look to explore the results of the Shapiro-Wilk and kpss tests. |
