Customizing Plots
Various operations can be performed on plots from the context menu, displayed by right-clicking the plot itself.
The following operations are available:
Operation | Description |
|---|---|
Zoom | Zooming in on a plot allows you to get the closer look of the particular area of interest. Select disables this mode, and Restore View returns the view to before the zoom operation. Select the section you want to zoom in on. |
Pan | Panning allows you to move the plot around to focus in on a target area. Select disables this mode, and Restore View returns the view to before the pan operation. |
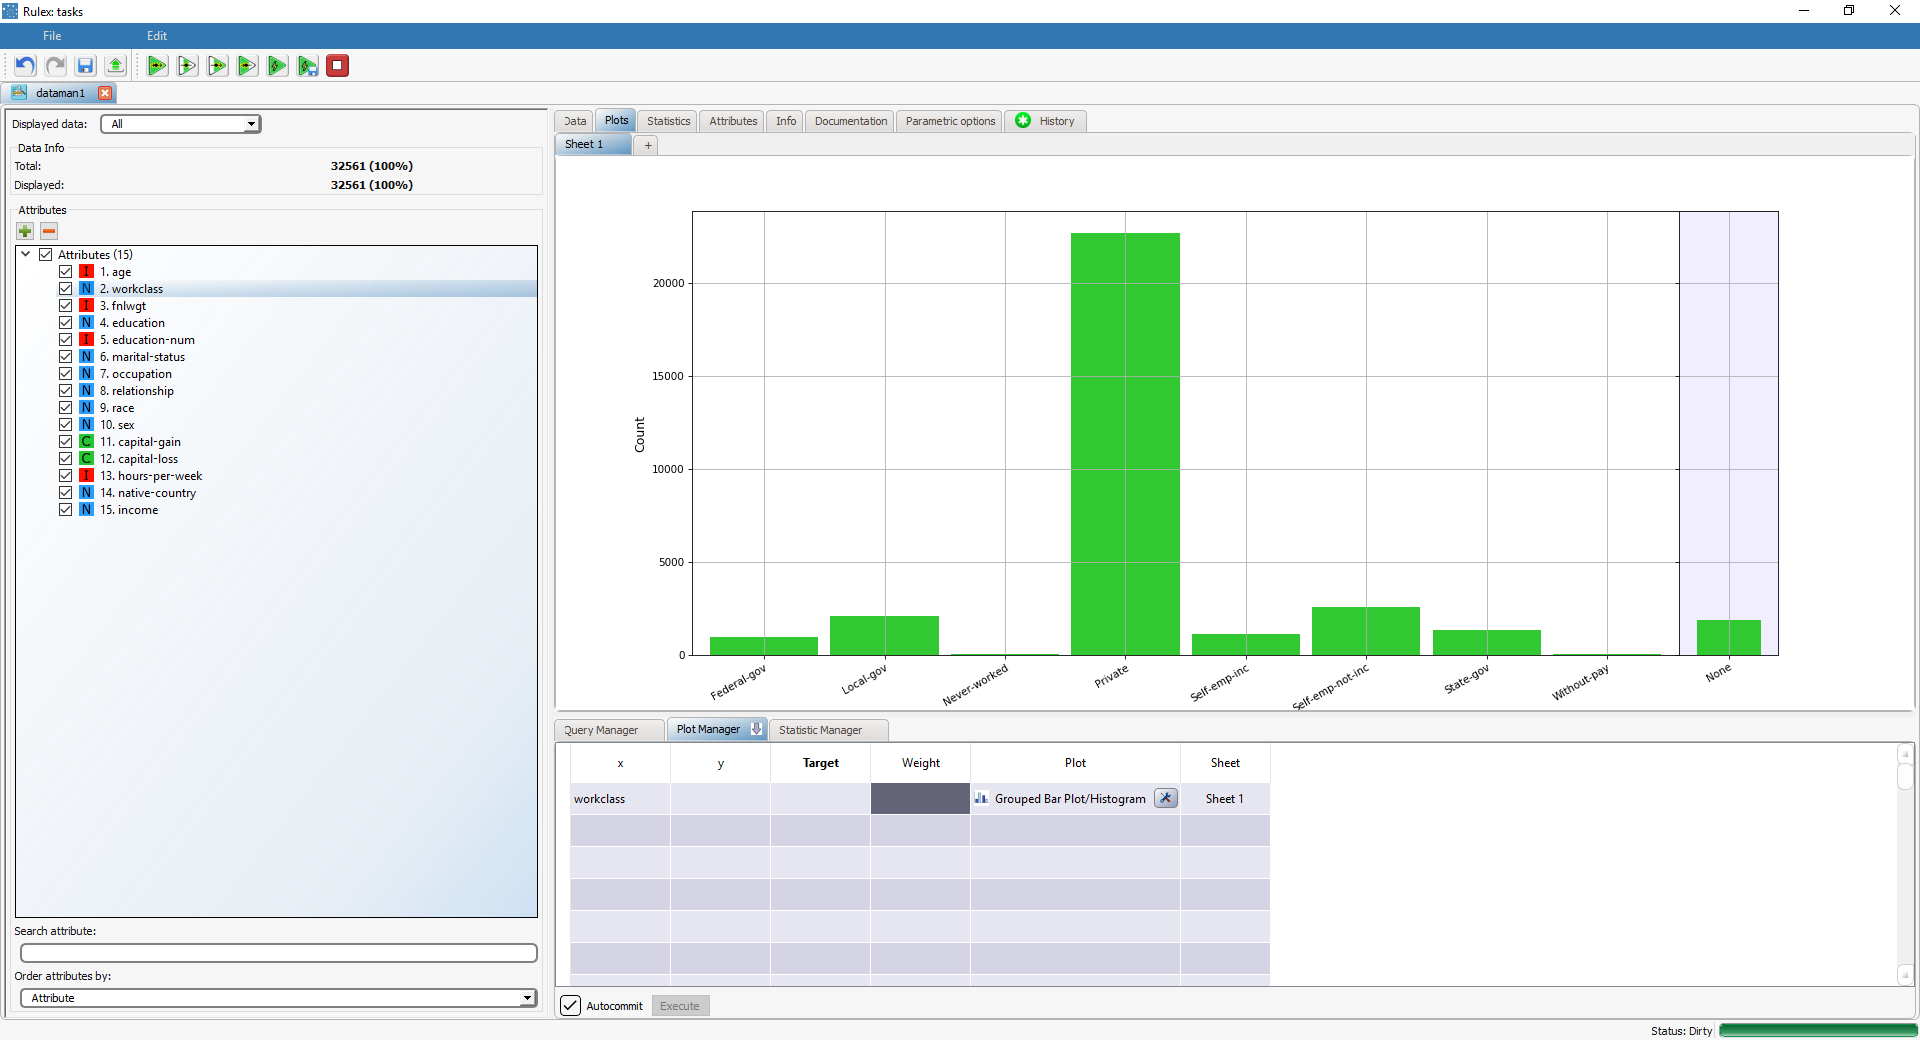
Insert > Annotation Text | Annotation text is displayed in a box, and is linked to its corresponding value with an arrow. In the displayed example, the annotation text is Value: 25046. |
Insert > Static Text | Static text displays the name of the plotted variable. In the displayed example, the static text is variable:workclass. |
Insert > Axes Text | Axes text is displayed along the axes, and depends on the axes coordinates. |
Automatic Rescale | This operation automatically rescales the axis limits, which is useful after manually changing the axis limits. It is displayed as an option only when you right-click within an axes frame. |
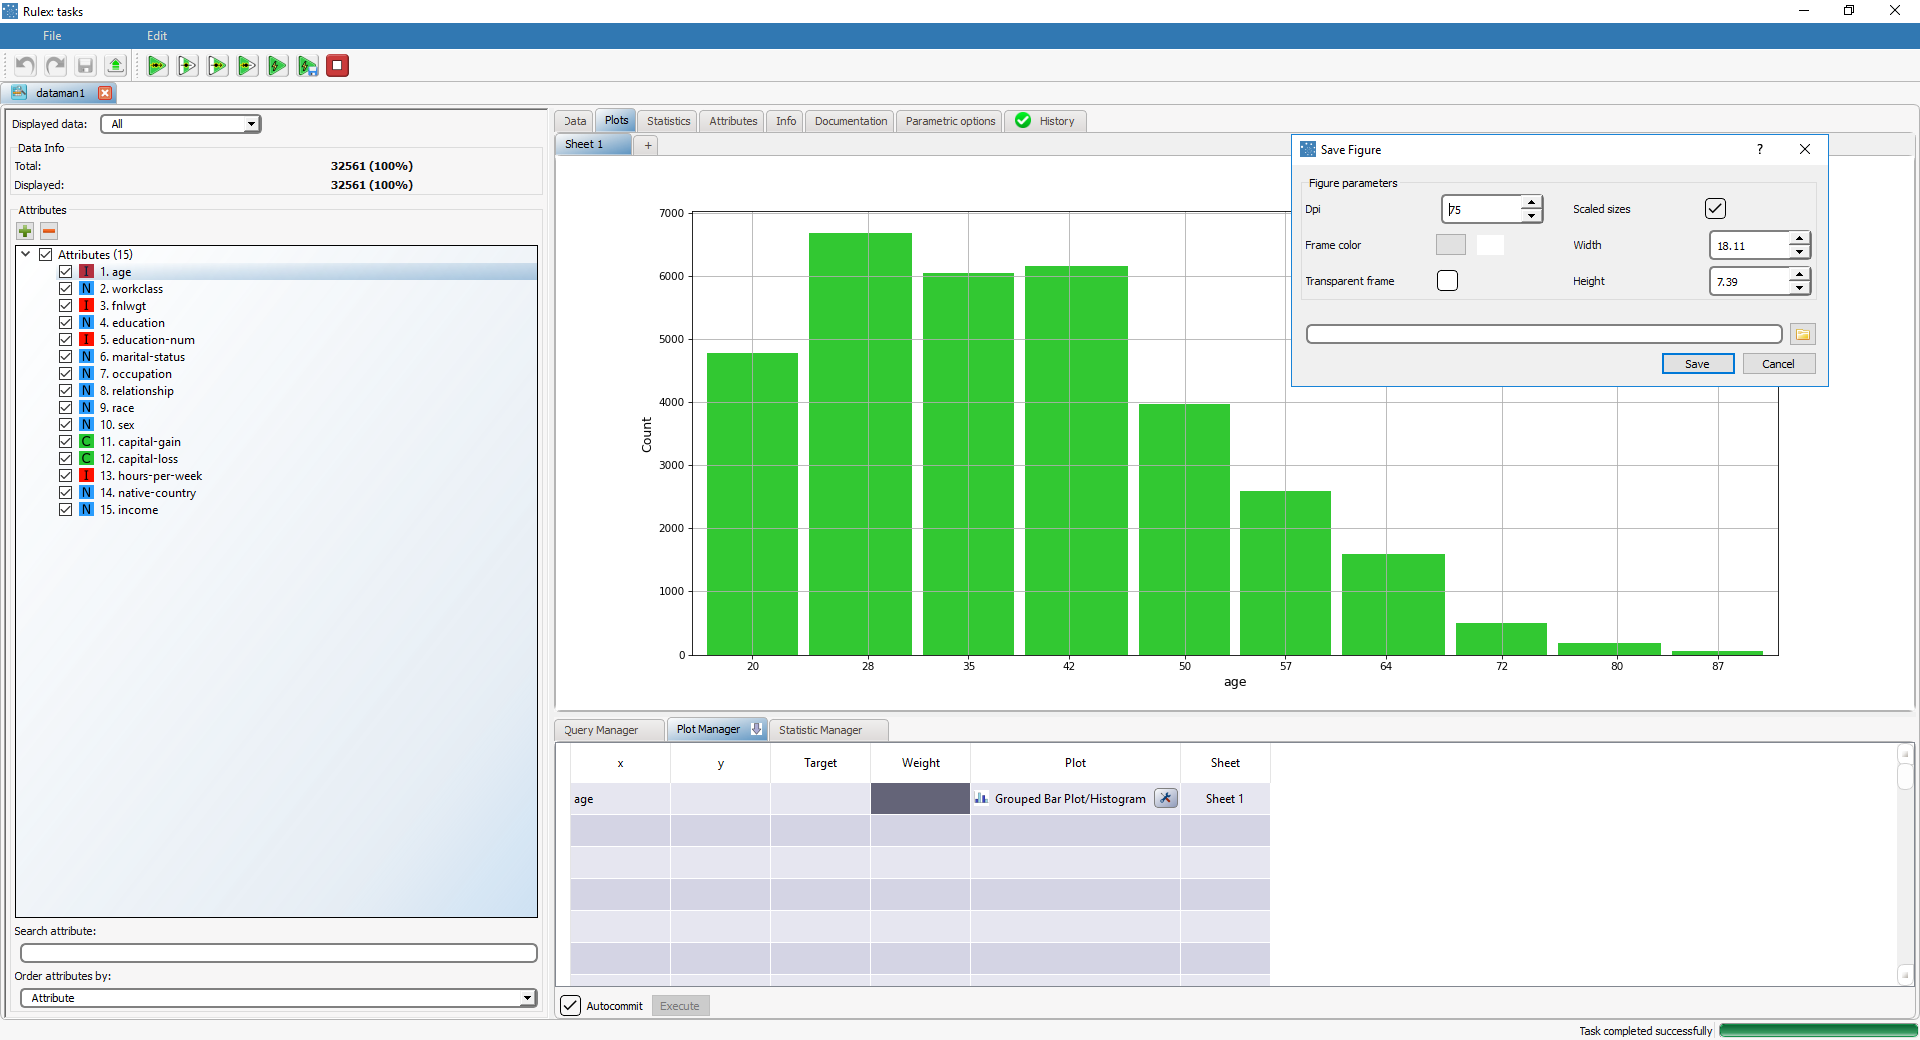
Save | Saving the plot allows you to export the figure created in the Plot Panel in PNG, PDF and raw format, after having changed any parameters of the figure through an additional window and a preview of the picture. |
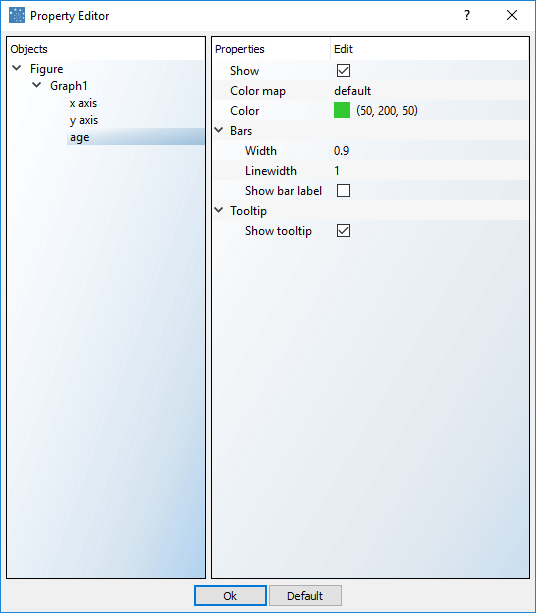
Properties | The Properties option allows you to edit graphic properties of the figure, axes frame and all the displayed plot (including texts and legends). This Property Editor can also be accessed by double-clicking on an element in the plot. For example, double-clicking on a bar of a histogram will display the graphic properties of the histogram, such as the color of the bars, whilst double-clicking outside of a plot but within an axes frame will display the graphic properties of the frame, such as the line width of the grid. |


