Managing Attribute Values
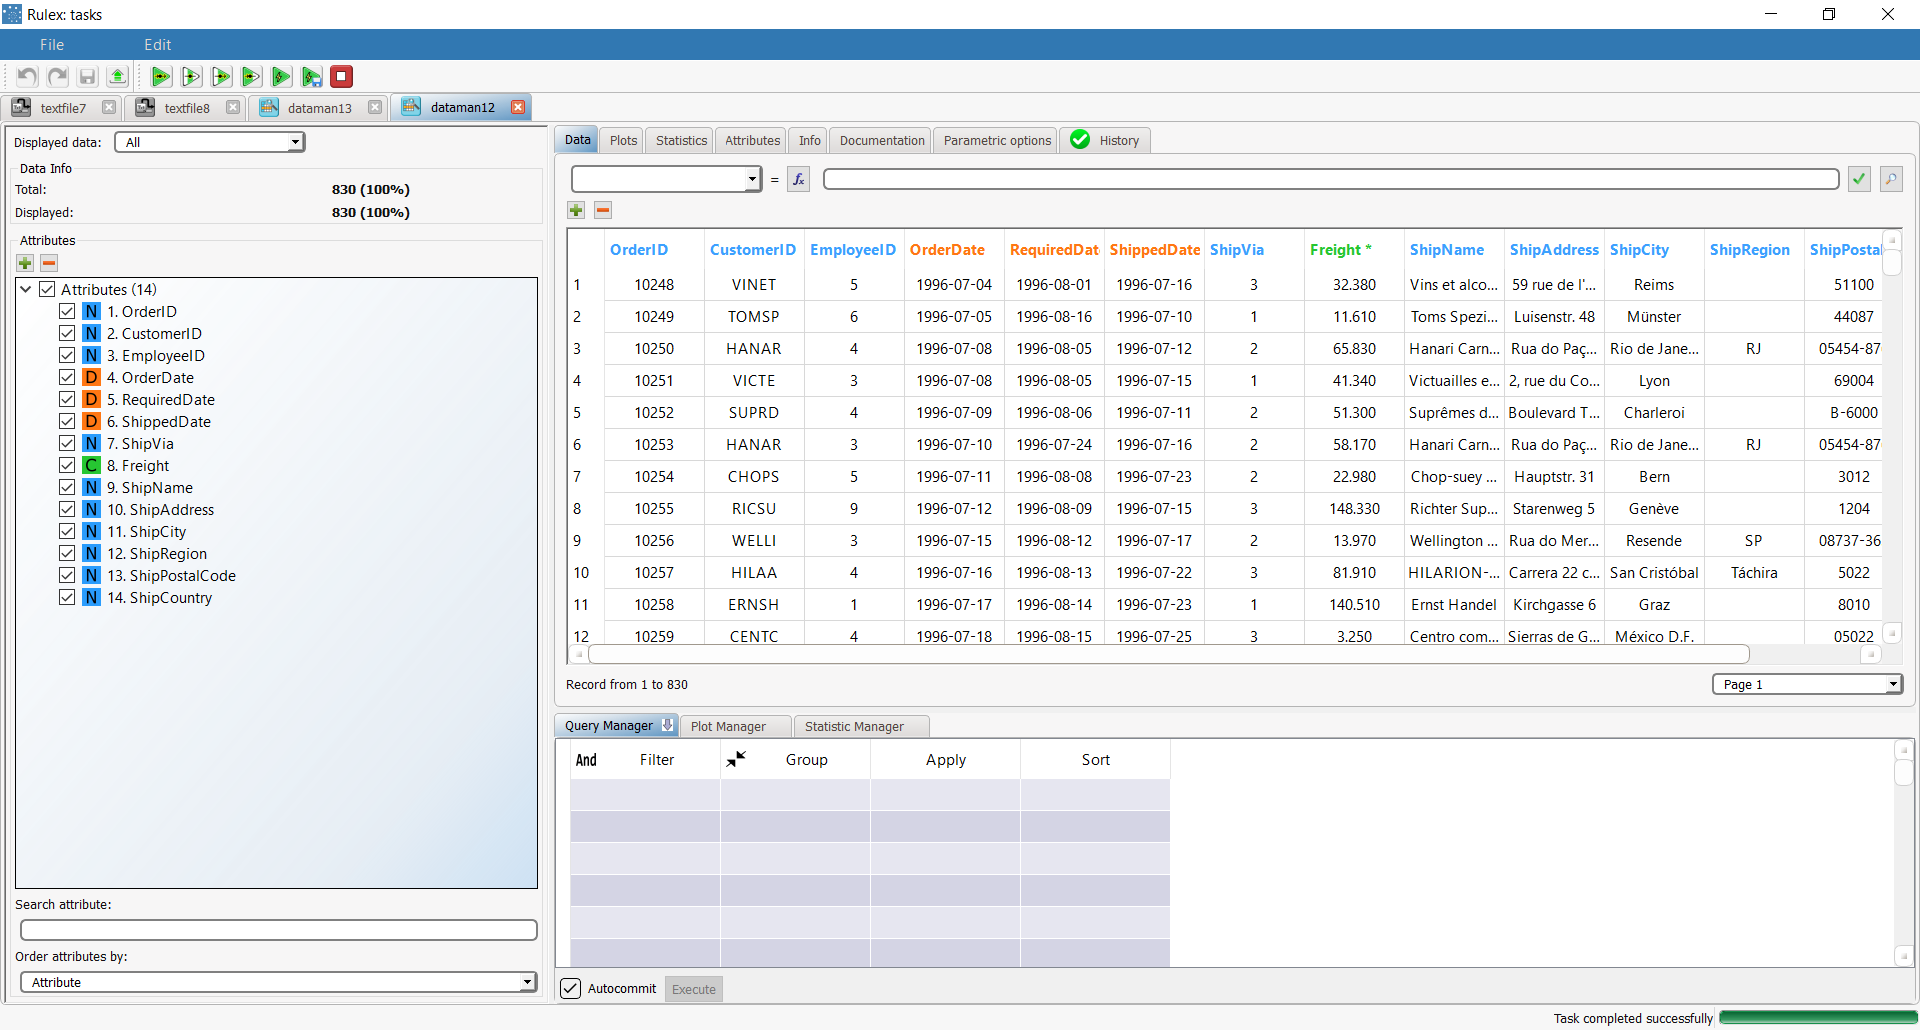
The Data tab in the Data Manager task displays the dataset in a spreadsheet format.

The following operations can be performed in this pane:
Name | Description |
|---|
Formula editor | In the formula editor bar you can compute formulas to define attributes. |
 | Here you can add or remove rows in the data grid: When you click the plus button the number of rows you specify will be added to the bottom of the data table. To remove a row or group of rows you can select them (using the Ctrl Shift for groups) and click the minu
|
Column headers | The column headers display the name of the attribute. |
| The data table is structured like an Excel spreadsheet. The following operations can be performed on the table: copy and paste cells. Transposed copy and paste operations can also be performed, where rows can be pasted as columns, and vice versa, as long as the new values are compatible with the destination type, otherwise, if possible, a cast in performed to make the destination type correct. Copy and paste operations can also be performed from the Statistics spreadsheet (see here) to the data spreadsheet. change the values of specific cells (Set assign the complete view to the training, test or validation sets in order to split the dataset. scroll down to a specific row (Go to row), which may be useful when the data set contains many rows.
Columns in the data table may also be highlighted in specific colors according to their roles: Yellow if the attribute role is output. Green or red if the attribute is the result of an Apply Model task. In classification problems the color is green if the is right, red if it is wrong. Orange if the attribute is the confidence level related to the prediction. Violet if the attribute is the index of the most important (generated by a previous task) which has been applied to generate the .
|

