Plotting Lorenz Curves
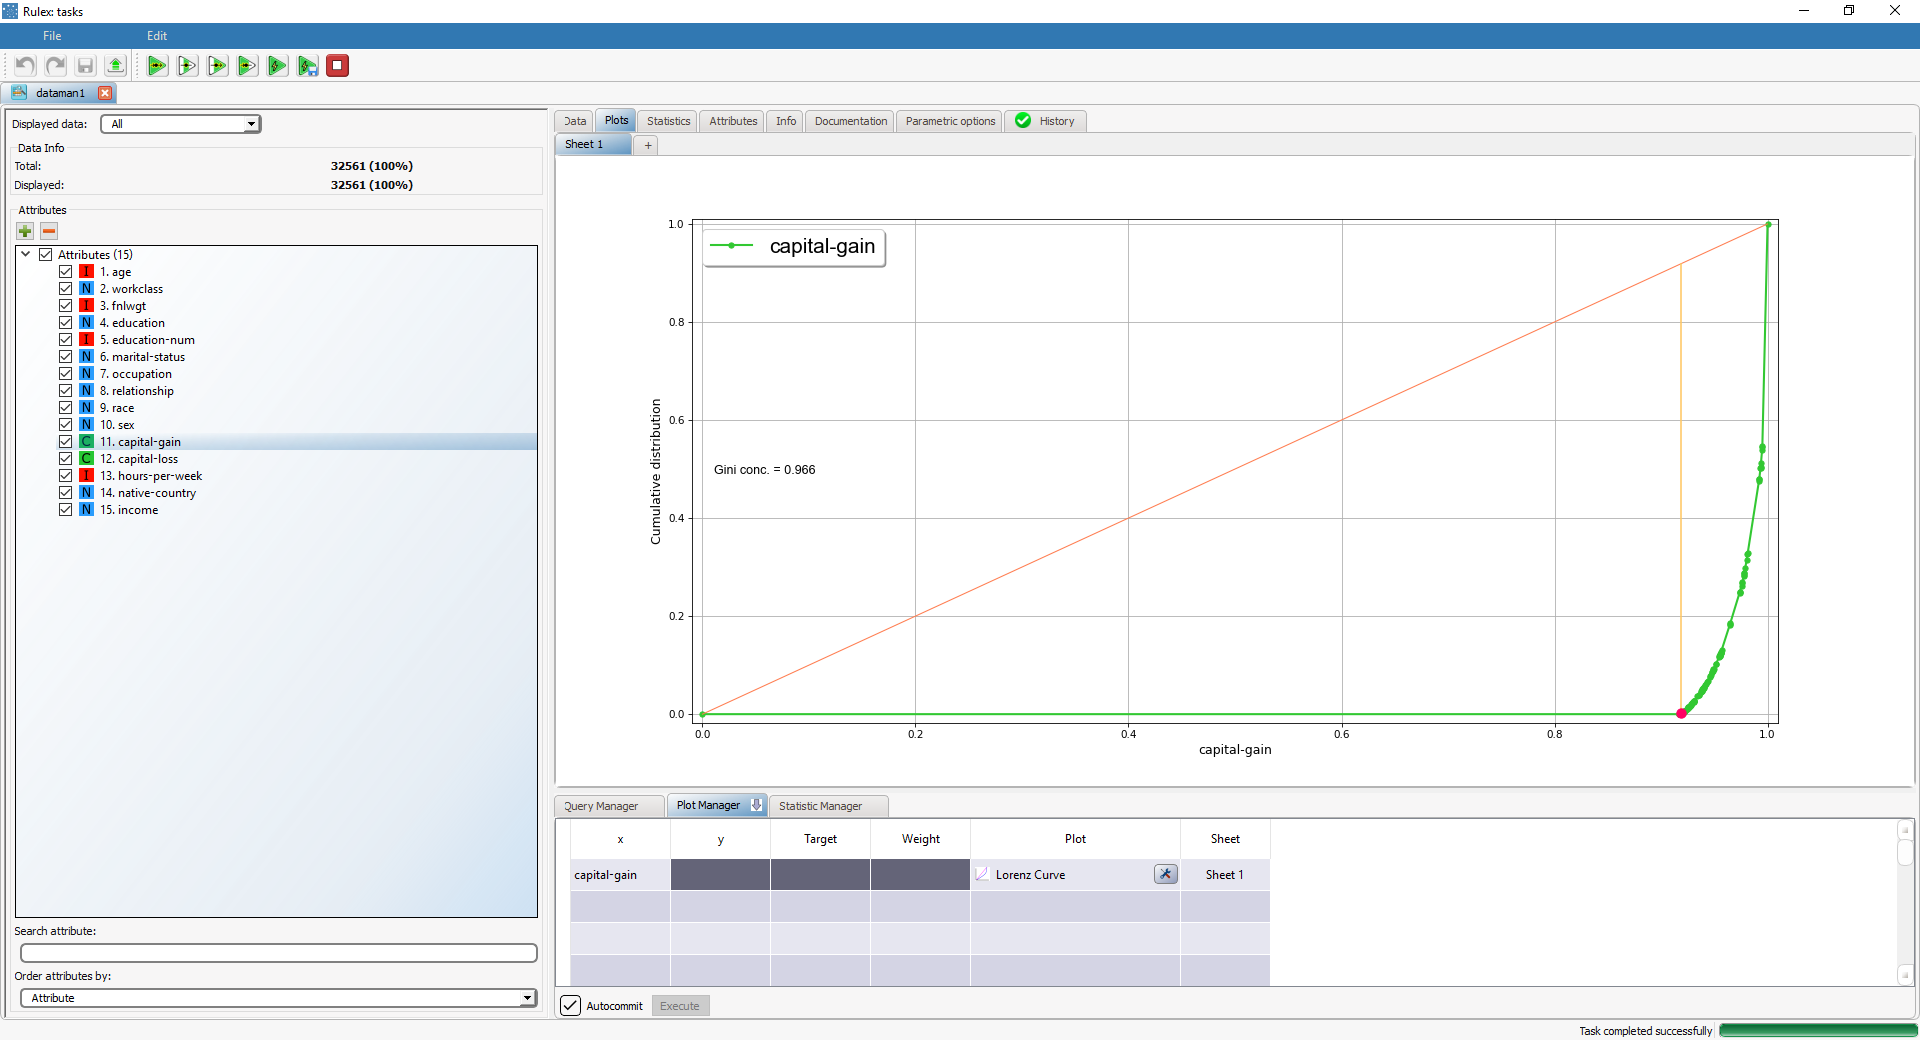
The Lorenz curve is a graphical representation of the Lorenz distribution, which is often associated with the distribution of wealth among the population, according to the Gini Index.
The more the curve sags below the straight diagonal line, the higher the degree of inequality of distribution.
It contains the following attribute:
Attribute | Mandatory | Constraints |
|---|---|---|
x | Yes | Only continuous and integer attributes are supported. |
Example
The following example is based on the Adult dataset.
Scenario data can be found in the Datasets folder in your Rulex installation.
Description | Result |
|---|---|
Dragging and dropping the capital-gain attribute onto an x cell and selecting Lorenz Curve in the Plot cell will display the Lorenz curve of the capital-gain attribute. |
