Plotting P-P Plots
A P-P Plot (Probability-Probability Plot) is a probability plot used to evaluate if a data set follows some specified distribution, plotting the two cumulative function against each other.
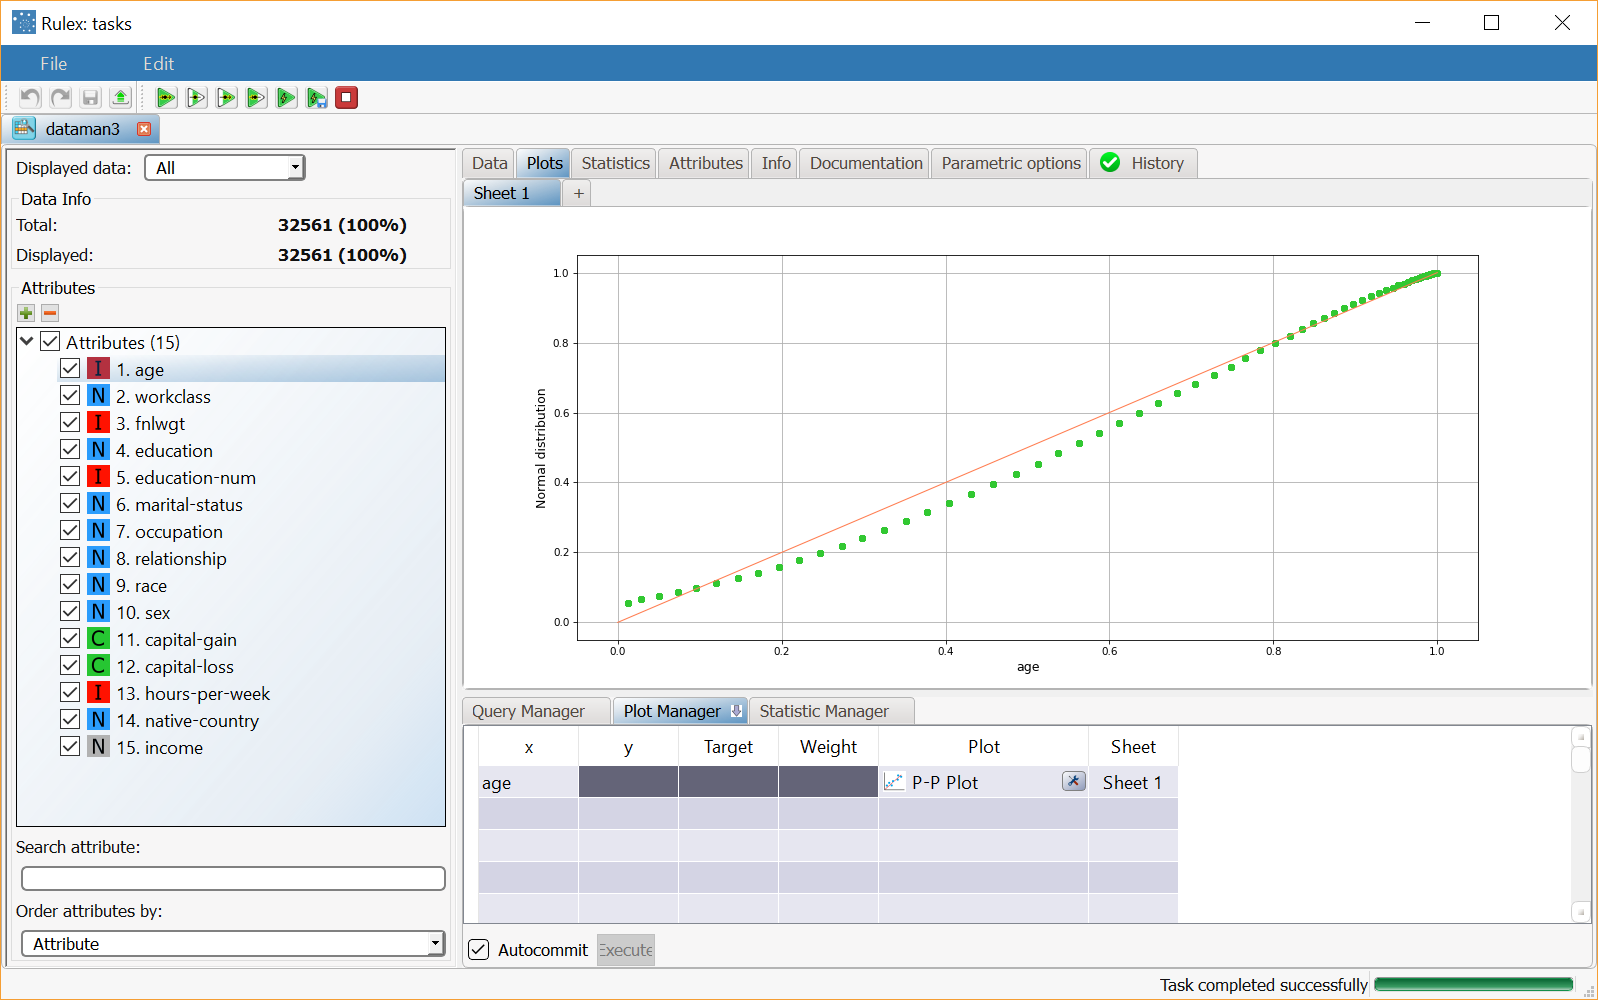
If a specified distribution is the correct model, the P-P plot should be approximately linear near the line y = x.
It contains the following attribute:
Attribute | Mandatory | Constraints |
|---|---|---|
x | Yes | Nominal attributes not supported |
Properties
Category | Properties | Description |
|---|---|---|
General parameters | Compared distribution | The family of distribution with which comparisons are performed can be selected from the following values: normal, beta or exponential. The corresponding options must then be specified below. |
Normal distribution parameters | Mean | Normal distribution is a continuous probability distribution where values are symmetrically distributed around the average value, defined here as the Mean µ. The Standard Deviation σ defines how far the displayed values can deviate from the mean. Normal distribution is defined as follows: where:
|
Standard deviation | ||
Beta distribution parameters | Alpha | Beta distribution displays a probabilistic display of probabilities, by defining Alpha (α) and Beta (β) values, which will be used to define the distribution as follows: where
|
Beta | ||
Exponential distribution parameters | Lambda | Exponential distribution calculates the time which occurs between two events, where the Lambda (λ) value specified here is the average number of events in 1 unit of time. The exponential distribution is given by: |
Examples
The following example is based on the Adult dataset.
Scenario data can be found in the Datasets folder in your Rulex installation.
Description | Result |
|---|---|
Dragging and dropping the age attribute onto an x cell and selecting P-P Plot in the Plot cell will display the P-P plot of the age attribute compared with the Normal distribution (default comparison). |


